Process And Flow Chart PTE Describe Image Tips
Describe a process chart in 25 seconds of prep and 40 seconds of speech: three answer templates, the linking language, and seven practical tips.

Lume Test
|
Dec 1, 2024
•
5 min read

Key Takeaways
- Describe a process chart in 25 seconds of prep and 40 seconds of speech: three answer templates, the linking language, and seven practical tips.
For first-time PTE test-takers, the Describe Image task in the speaking section can be a real challenge.
It encompasses many types of images, including the process chart PTE Describe Image.
If you don’t know where to start, we’re here to help!
LUME Test will provide effective and practical strategies to help you confidently analyze any process chart.
Let’s take a look.
|
Want to FINALLY Pass the PTE Test And Achieve Your Goals? Get Your FREE Lume Account Today to Unlock… ✅ 10,000+ PRACTICE QUESTIONS with detailed answers ✅ FREE MOCK TESTS with fast & accurate AI scoring ✅ Get BETTER SCORES with a PERSONALIZED study plan (Limited seats available!) |
Key Takeaways
- You have 25 seconds to prepare for the PTE process chart questions and 40 seconds to deliver your response.
- Analyze each step or stage of the process in a fixed, logical sequence, ensuring smooth expression.
- Use linking verbs and transitional phrases to connect different steps of the process.
- The three answer templates below will help you form a general understanding of the flow chart PTE Describe Image section.
Related:
- Free PTE mock tests with AI scoring
- An effective PTE study plan with tips and tricks
- Everything you need to know about the PTE Speaking section
- PTE Describe Image table chart tips & tricks
An Overview of the PTE Describe Image Process/Flow Chart
As its name suggests, the PTE process chart section will show an image containing a general process, such as a manufacturing procedure or an animal’s life cycle. To ace it, you must describe the process’s details and link them properly.
Like many other tasks in the PTE Describe Image section, you have 25 seconds to prepare your answer and 40 seconds to deliver your response. Due to the time constraint, quickly look at the process, identify key information, and present it concisely.
How to Answer The Process Chart Questions In PTE Describe Image?
To answer the process chart questions effectively, you’d better build a strong vocabulary related to this topic. Try to use some synonyms of process and other related words/phrases, such as procedure, sequence, operation, stages, progression, workflow, etc.
To make your presentation smoother:
- Use various transitional words.
- For instance, use “first,” “second,” and “third” to clarify the chronological order.
- Use “afterword,” “next,” and “then” to connect different stages of the process.
Here is a detailed answer template you can consider:
- Intro: Give a brief overview of the process by introducing its chart type, name, title, and main subject.
- Body: Analyze each step or stage of the process in a fixed, logical sequence. Presenting the process chart in a jumbled order can lead to confusion and misunderstanding among assessors, resulting in low scores.
Additionally, it is advisable to focus on 2 to 3 important stages of the process. This approach allows for detailed explanation and deep exploration of the topic, helping your analysis become more informative.
- Conclusion: Wrap up the matter in 1 to 2 single sentences. Keep your conclusion brief and concise for easy comprehension.
Process Chart Samples & Answers
PTE Process Chart – Sample 1
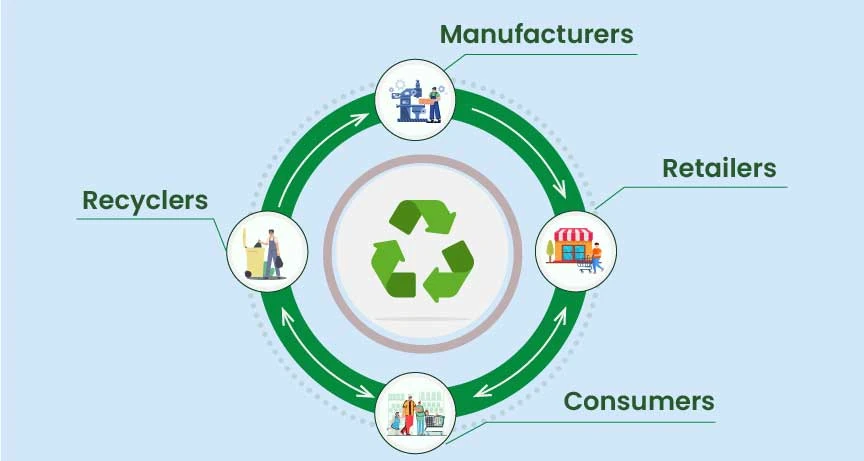
The process chart illustrates the process of recycling used and unwanted products. Specifically, manufacturers distribute products to retailers, who will sell them to consumers.
After completing the product utilization, those goods will be delivered to recyclers. They are responsible for gathering and classifying unwanted products and reproducing these into raw materials before transporting them to the manufacturers.
In conclusion, the recycling practice involves the participation of four members, all contributing to an eco-friendly environment.
PTE Process Chart – Sample 2
The given image demonstrates the process of producing household electricity using solar panels. Installed on the house’s rooftop, solar panels will collect sunlight and transform it into DC.
Then, this DC electricity will be directed to an inverter, which plays a pivotal role in converting this energy into AC. Also, an inverter helps manage electricity generation and spreads it throughout the entire home.
Suppose the solar panels produce insufficient electricity. In that case, the utility grid supplements the extra power to meet the household’s energy demands.
PTE Process Chart – Sample 3
The diagram illustrates the inquiry process and terms of reference for Australia in 2015. The process begins with an initial research and consultations. Then, an issue paper is developed to highlight key concerns and areas requiring detailed analysis, coupled with a call for submissions.
The received submission will be thoroughly examined, resulting in the development of a Discussion Paper. After another discussion paper and further consultations, a final report will be made and submitted to the government for review and action.
The process concludes with the government issuing a formal response, which may involve potential legislative changes.
7 Helpful Tips To Excel In The Process Chart PTE Describe Image?
Below are practical tips and tricks to help candidates ace the PTE process chart questions properly.
- Check the title: When you are presented with an image, look at the process title first. In this way, you can form an overall understanding and grasp the main subject of your later presentation.
- Be selective: If the process is pretty concise, with 3 to 4 steps in total, you should try to describe them all. However, suppose the given procedure contains 6 to 7 stages. In that case, choose key steps to detail (briefly mention other minor steps).
- Mind the order: Every process follows a logical order. Therefore, to achieve a high score on this task, you must mention the process steps sequentially. Avoid describing them in a messy structure.
- Use linking verbs and transitional words: They help connect different steps of the process. This facilitates your expression to be smoother and more engaging.
- Control your pace: Speak at a moderate pace, so you have enough time to prepare. Avoid rushing or speaking too fast, as you might easily stumble over words.
- Vary your vocabulary: Use diverse vocabulary, from simple to advanced words, and different sentence structures in your pictorial presentation.
- Stay calm and be confident: Ignore mistakes and continue your presentation.
Conclusion
We hope you’ve learned more about the format, answer template, and practical tips to ace the process chart PTE Describe Image section.
To master this task, you should build a robust vocabulary and grammar foundation coupled with logical presentation.
To hone these skills, check out other posts on the LUME Test website and reach out to us for support.
(Read our Vietnamese version here)
|
Want to FINALLY Pass the PTE Test And Achieve Your Goals? Get Your FREE Lume Account Today to Unlock… ✅ 10,000+ PRACTICE QUESTIONS with detailed answers ✅ FREE MOCK TESTS with fast & accurate AI scoring ✅ Get BETTER SCORES with a PERSONALIZED study plan (Limited seats available!) |
Share:


Lume Test
Editor
Passionate about helping learners master English exams with AI-driven insights and structured learning paths.
Practice PTE Academic with Lume
AI-powered scoring, realistic mock tests, and smart feedback tailored to your target score.